Affordable Housing Real Estate Statistics
Get expert property management insights, straight to your inbox.
Affordable housing real estate statistics get quoted constantly. Fewer people read them carefully.
Numbers like "7.1 million unit shortage" or "50% of renters cost-burdened" circulate widely, but what they mean operationally for the people managing these properties rarely gets unpacked.
How tight is inventory, really? Where is rent growth heading? What compliance exposure comes with a LIHTC portfolio in 2025 and beyond?
This guide pulls together the most credible, up-to-date affordable housing statistics across inventory, demand, cost burden, funding, and market projections. Each section is sourced. Each number is traceable.
What Qualifies as Affordable Housing in the U.S.?
Affordable housing in the United States is defined using a housing affordability standard tied to household income. A home or rental unit is considered affordable when a household spends no more than 30% of its gross income on housing costs, including rent or mortgage payments and basic housing expenses.
This benchmark is widely used by housing researchers, federal programs, and housing surveys.
According to the U.S. Department of Housing and Urban Development (HUD), households that spend more than 30% of their income on housing are considered cost-burdened, while those spending over 50% are classified as severely cost-burdened.
Housing affordability definitions are also reflected in national housing data collected by the U.S. Census Bureau through its housing and income surveys.
For example:
This affordability threshold is used across federal, state, and local housing programs to determine eligibility for housing assistance, rental subsidies, and income-restricted apartment communities.
Affordable housing programs frequently calculate eligibility using Area Median Income (AMI). AMI represents the median household income in a specific city or region. Housing assistance programs may restrict units to households earning a percentage of that income level.
Typical eligibility levels include:
- 80% of the area median income: moderate-income housing programs
- 60% of the area median income: many income-restricted apartment communities
- 30%–50% of the area median income: deeply subsidized housing programs
These limits vary by location because housing markets differ widely between cities and states. For example, housing costs in large markets such as California or major metro areas often require higher income thresholds than smaller regions such as South Dakota or Maine.
Researchers and housing policy organizations also analyze national data to understand the gap between rent levels and income.
One major finding highlights the shortage of affordable rental housing nationwide:
- The United States has a shortage of 7.1 million affordable, available rental homes for extremely low-income renters. That means only 35 affordable rental homes exist for every 100 extremely low-income renter households in the country.
This imbalance between rent prices and household income is a central factor in the housing affordability problem affecting millions of renters nationwide.
Affordable housing policies attempt to address this gap through a combination of approaches, including:
- Income-restricted apartment developments
- Affordable housing and rental subsidies
- Public housing programs
- Tax credit housing developments
- Community housing assistance programs
These programs help families, seniors, and working adults access housing that aligns with their ability to pay.
For property management professionals, understanding how affordability is measured is important when evaluating rental markets, participating in housing programs, or managing properties connected to affordable housing initiatives.
National Affordable Housing Market Snapshot (2026 Data Overview)
Housing affordability in the United States remains a major housing and rental market challenge in 2026. National research and housing surveys continue to show that rent prices, income levels, and housing supply remain out of balance in many cities and regions across the country.
Below is a 2026 data snapshot highlighting the most credible statistics related to housing affordability, renters, and the national housing market.
- The global affordable housing market is projected to reach $63.29 billion by 2026, growing at a 5.5% compound annual growth rate.
- More than 770,000 people experienced homelessness in the United States in 2024, an 18% increase from the previous year, reflecting growing housing affordability pressure nationwide that continues into the 2026 housing outlook.
Housing affordability pressure also varies significantly by state and region.
- California recorded one of the highest housing cost burdens, with 40.6% of households spending more than 30% of their income on housing costs.
- More than 80% of households in states such as Hawaii, Maine, and New Hampshire were unable to afford the median-priced new home.
Housing supply also continues to affect affordability across cities and neighborhoods.
- Rentals priced under $1,000 per month declined by more than one-third between 2013 and 2023, reducing affordable housing options for millions of renters nationwide.
For property management professionals analyzing residential real estate statistics, these trends highlight a widening gap between housing costs and household income. Rising rents, limited affordable supply, and population growth continue to affect housing affordability across the country.
Affordable housing policies, rental subsidies, and housing assistance programs remain central tools used by federal and state governments to support families and residents who cannot afford market-rate housing in many U.S. cities.
Affordable Housing Inventory & Vacancy Rate Statistics
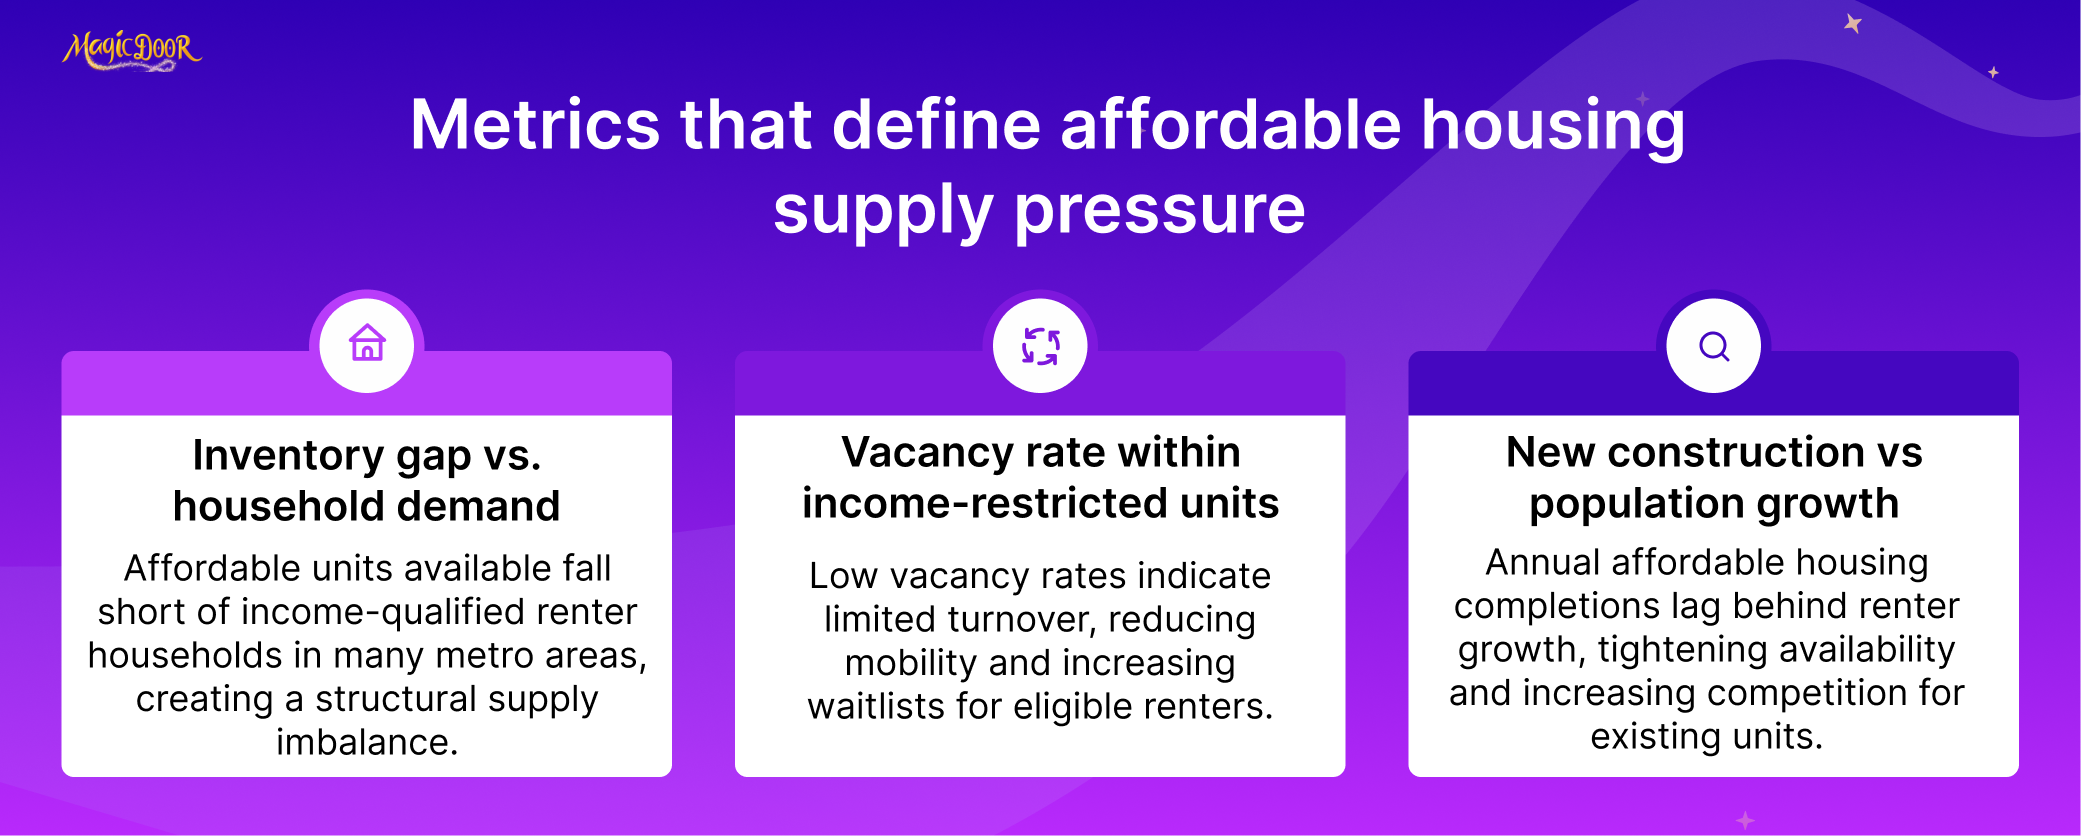
Housing inventory and vacancy levels provide important signals about the availability of affordable rental housing in the United States. When vacancy rates remain low while housing costs increase, renters and families have fewer options to find housing they can afford in their location.
National housing surveys and research reports show that the supply of affordable rental units continues to weaken behind demand in many regions of the country.
- The U.S. rental vacancy rate was 6.6% in the fourth quarter of 2024, according to housing data released by the U.S. Census Bureau.
- The national homeowner vacancy rate remained extremely low at 0.8%, indicating a limited housing inventory nationwide.
Low vacancy rates affect both renters and housing affordability. When fewer rental homes are available, rent prices increase in many cities and states, making it harder for families and residents to afford housing.
Inventory pressure is also visible in the composition of the rental housing stock.
- Units priced below $600 per month accounted for only 14% of available rentals in 2023, reflecting a long-term decline in lower-cost rental inventory.
At the same time, homeownership affordability continues to influence rental demand.
- The U.S. homeownership rate declined from 65.6% in 2024 to 65.1% by early 2025, pushing more households toward the rental housing market.
Housing inventory shortages also affect development pipelines.
- The Low-Income Housing Tax Credit (LIHTC) program has experienced a20-year slowdown in new development in some regions, contributing to a reduction in affordable housing inventory in certain states.
These supply constraints are visible across different housing types.
Single-family real estate statistics, residential real estate statistics, and student housing rental statistics all point to rising demand for rental housing while affordable inventory remains limited.
For property management professionals, vacancy rates and housing inventory levels provide useful indicators when evaluating rental markets. Monitoring national housing data, census surveys, and housing research can help rental management teams understand where housing shortages are occurring and how rental demand may evolve in specific states or cities.
Affordable Housing Demand, Waitlist, & Occupancy Data
Demand for affordable housing in the United States continues to exceed supply in many rental markets. National housing research and federal housing program data show long waitlists for subsidized units and consistently high occupancy rates in income-restricted housing developments.
These statistics highlight the scale of demand among renters and families seeking affordable housing.
- Public housing programs serve about 2.3 million households across the United States, according to federal housing program data from the U.S. Department of Housing and Urban Development (HUD).
- The Housing Choice Voucher program assists roughly 2.3 million households with rental assistance%2C%20it%20subsidizes%20the%20rents%20of%20more,funding%20accounts%20for%20more%20than%20half%20the), helping renters afford housing in the private rental market.
Despite these programs, demand remains far higher than the available supply of subsidized housing units.
- The national average wait time for a Housing Choice Voucher can exceed two years, depending on the city or housing authority managing the program.
Some metropolitan housing authorities report even longer waitlists, reflecting the ongoing housing affordability problem affecting millions of renters.
Occupancy rates in affordable housing developments also reflect demand levels.
- Affordable housing properties financed through federal housing programs typically operate with occupancy rates above 95%.
High occupancy levels indicate that units rarely remain vacant once they become available. Property managers overseeing income-restricted properties often receive multiple tenant applications for a single available unit.
Demand for rental housing is also influenced by broader housing market conditions.
Rising mortgage rates and limited home affordability have pushed more households into the rental market, according to several U.S. mortgage statistics reports from federal housing agencies.
These conditions affect multiple housing segments, including student housing rental statistics and single-family rental markets, both of which have experienced increasing demand from renters who cannot afford homeownership.
For property management professionals, these demand indicators underscore the importance of efficient tenant screening, waitlist management, and financial tracking. Tools such as rent reconciliation systems and structured rental management workflows help property managers track tenant balances and manage occupancy in high-demand affordable housing communities.
Rent-to-Income Ratios & Cost-Burden Statistics
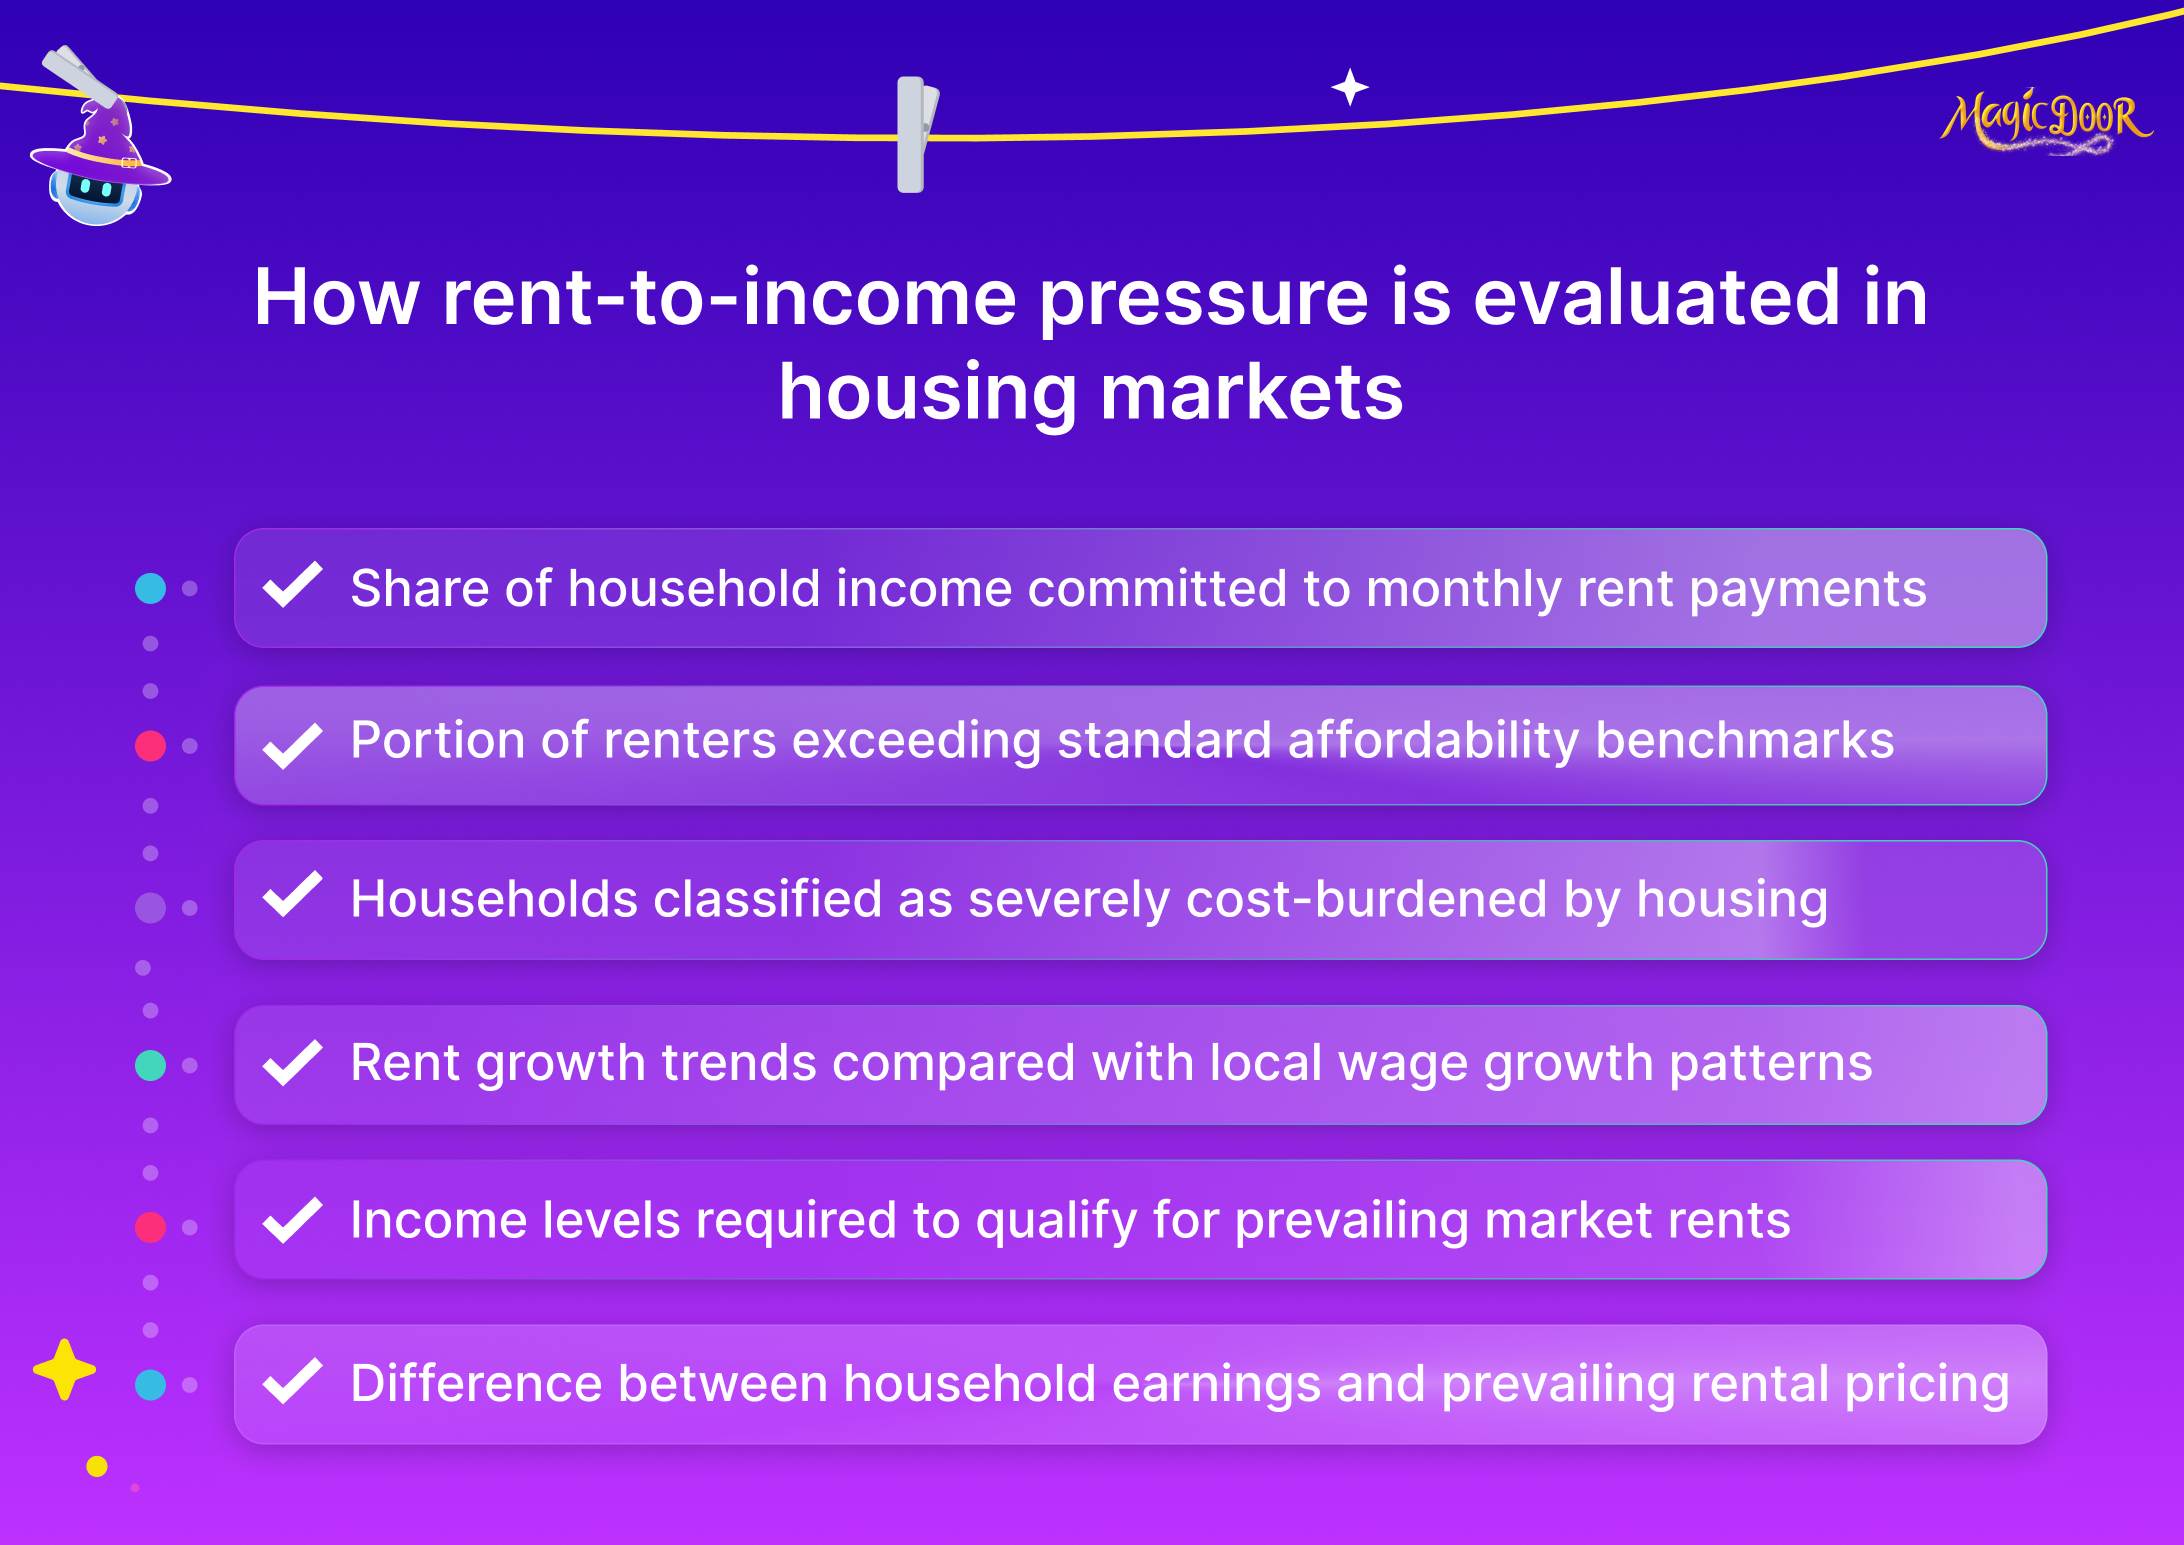
Rent-to-income ratios are among the most widely used indicators of housing affordability. Housing researchers and federal housing programs classify households as cost-burdened when housing expenses exceed 30% of household income, and severely cost-burdened when those costs exceed 50% of income.
Recent national housing data highlights how rising rent prices and slower income growth continue to affect renters across the United States.
- More than 22.4 million renter households were cost-burdened in 2022, meaning they spent over 30% of their income on housing costs.
- About 12.1 million renter households were severely cost-burdened, spending more than half of their income on rent and housing expenses.
Housing affordability pressures also affect younger adults and first-time renters.
- Nearly half of renter households under age 30 spent more than 30% of their income on housing, according to national housing affordability research.
Rent-to-income pressure also varies by region and metropolitan area. High-cost housing markets tend to show the largest gaps between rent levels and household earnings.
Mortgage market conditions also influence rent-to-income ratios. Higher borrowing costs make homeownership less accessible, which pushes more households into the rental market.
- The average 30-year fixed mortgage rate reached about 6.7% in 2024, affecting home affordability and increasing pressure on rental markets.
Housing researchers often analyze these trends alongside more general US renter and homeowner statistics, US mortgage statistics, and US foreclosure statistics to understand how economic conditions affect housing demand.
During economic downturns, researchers frequently study questions such as “does rent decrease during a recession?” While rent growth may slow during recessions, many markets still face limited housing supply, which prevents large rent declines.
For property management professionals, monitoring rent-to-income ratios provides useful insight into tenant affordability trends. Understanding these ratios can help guide pricing strategies, tenant screening decisions, and financial planning within rental management operations.
Federal & State Affordable Housing Funding Statistics
Federal and state governments play a major role in financing affordable housing development, rental assistance programs, and housing support services across the United States. Funding flows through tax credits, grants, and housing assistance programs that help expand access to housing for renters and families who cannot afford market-rate housing.
Below are key statistics that show how affordable housing funding is distributed nationally.
- The Low-Income Housing Tax Credit (LIHTC) program has financed the development of more than 3.7 million affordable housing units since its creation in 1986.
- The LIHTC program supports approximately 125,000 new affordable rental units each year.) across the United States.
- The HOME Investment Partnerships Program allocated about $1.5 billion in federal funding for affordable housing development and rehabilitation in fiscal year 2023.
- The Community Development Block Grant (CDBG) program distributed more than $3.3 billion to states and local governments for housing and community development programs.
State governments also contribute significant funding to affordable housing initiatives through housing trust funds and development grants.
Private-sector investment also supports housing development.
- Major financial institutions have pledged substantial funding for affordable housing construction, including a $60 billion commitment from Citi to finance affordable housing projects by 2026.
Housing researchers also highlight the broader economic impact of affordable housing investment.
- The shortage of affordable housing is estimated to cost the U.S. economy about $2 trillion per year in lost wages and productivity.
Affordable housing funding programs play an important role in addressing this gap by supporting construction, rehabilitation, and housing assistance for renters across the country.
For property managers overseeing affordable housing properties, understanding how these programs operate is important when managing compliance requirements, tenant eligibility, and reporting obligations. Effective operational practices, including accurate reporting, tenant management tips, and financial tracking tools, help property managers maintain program compliance while supporting residents who rely on affordable housing assistance programs.
Regional Analysis of U.S. Affordable Housing in 2026
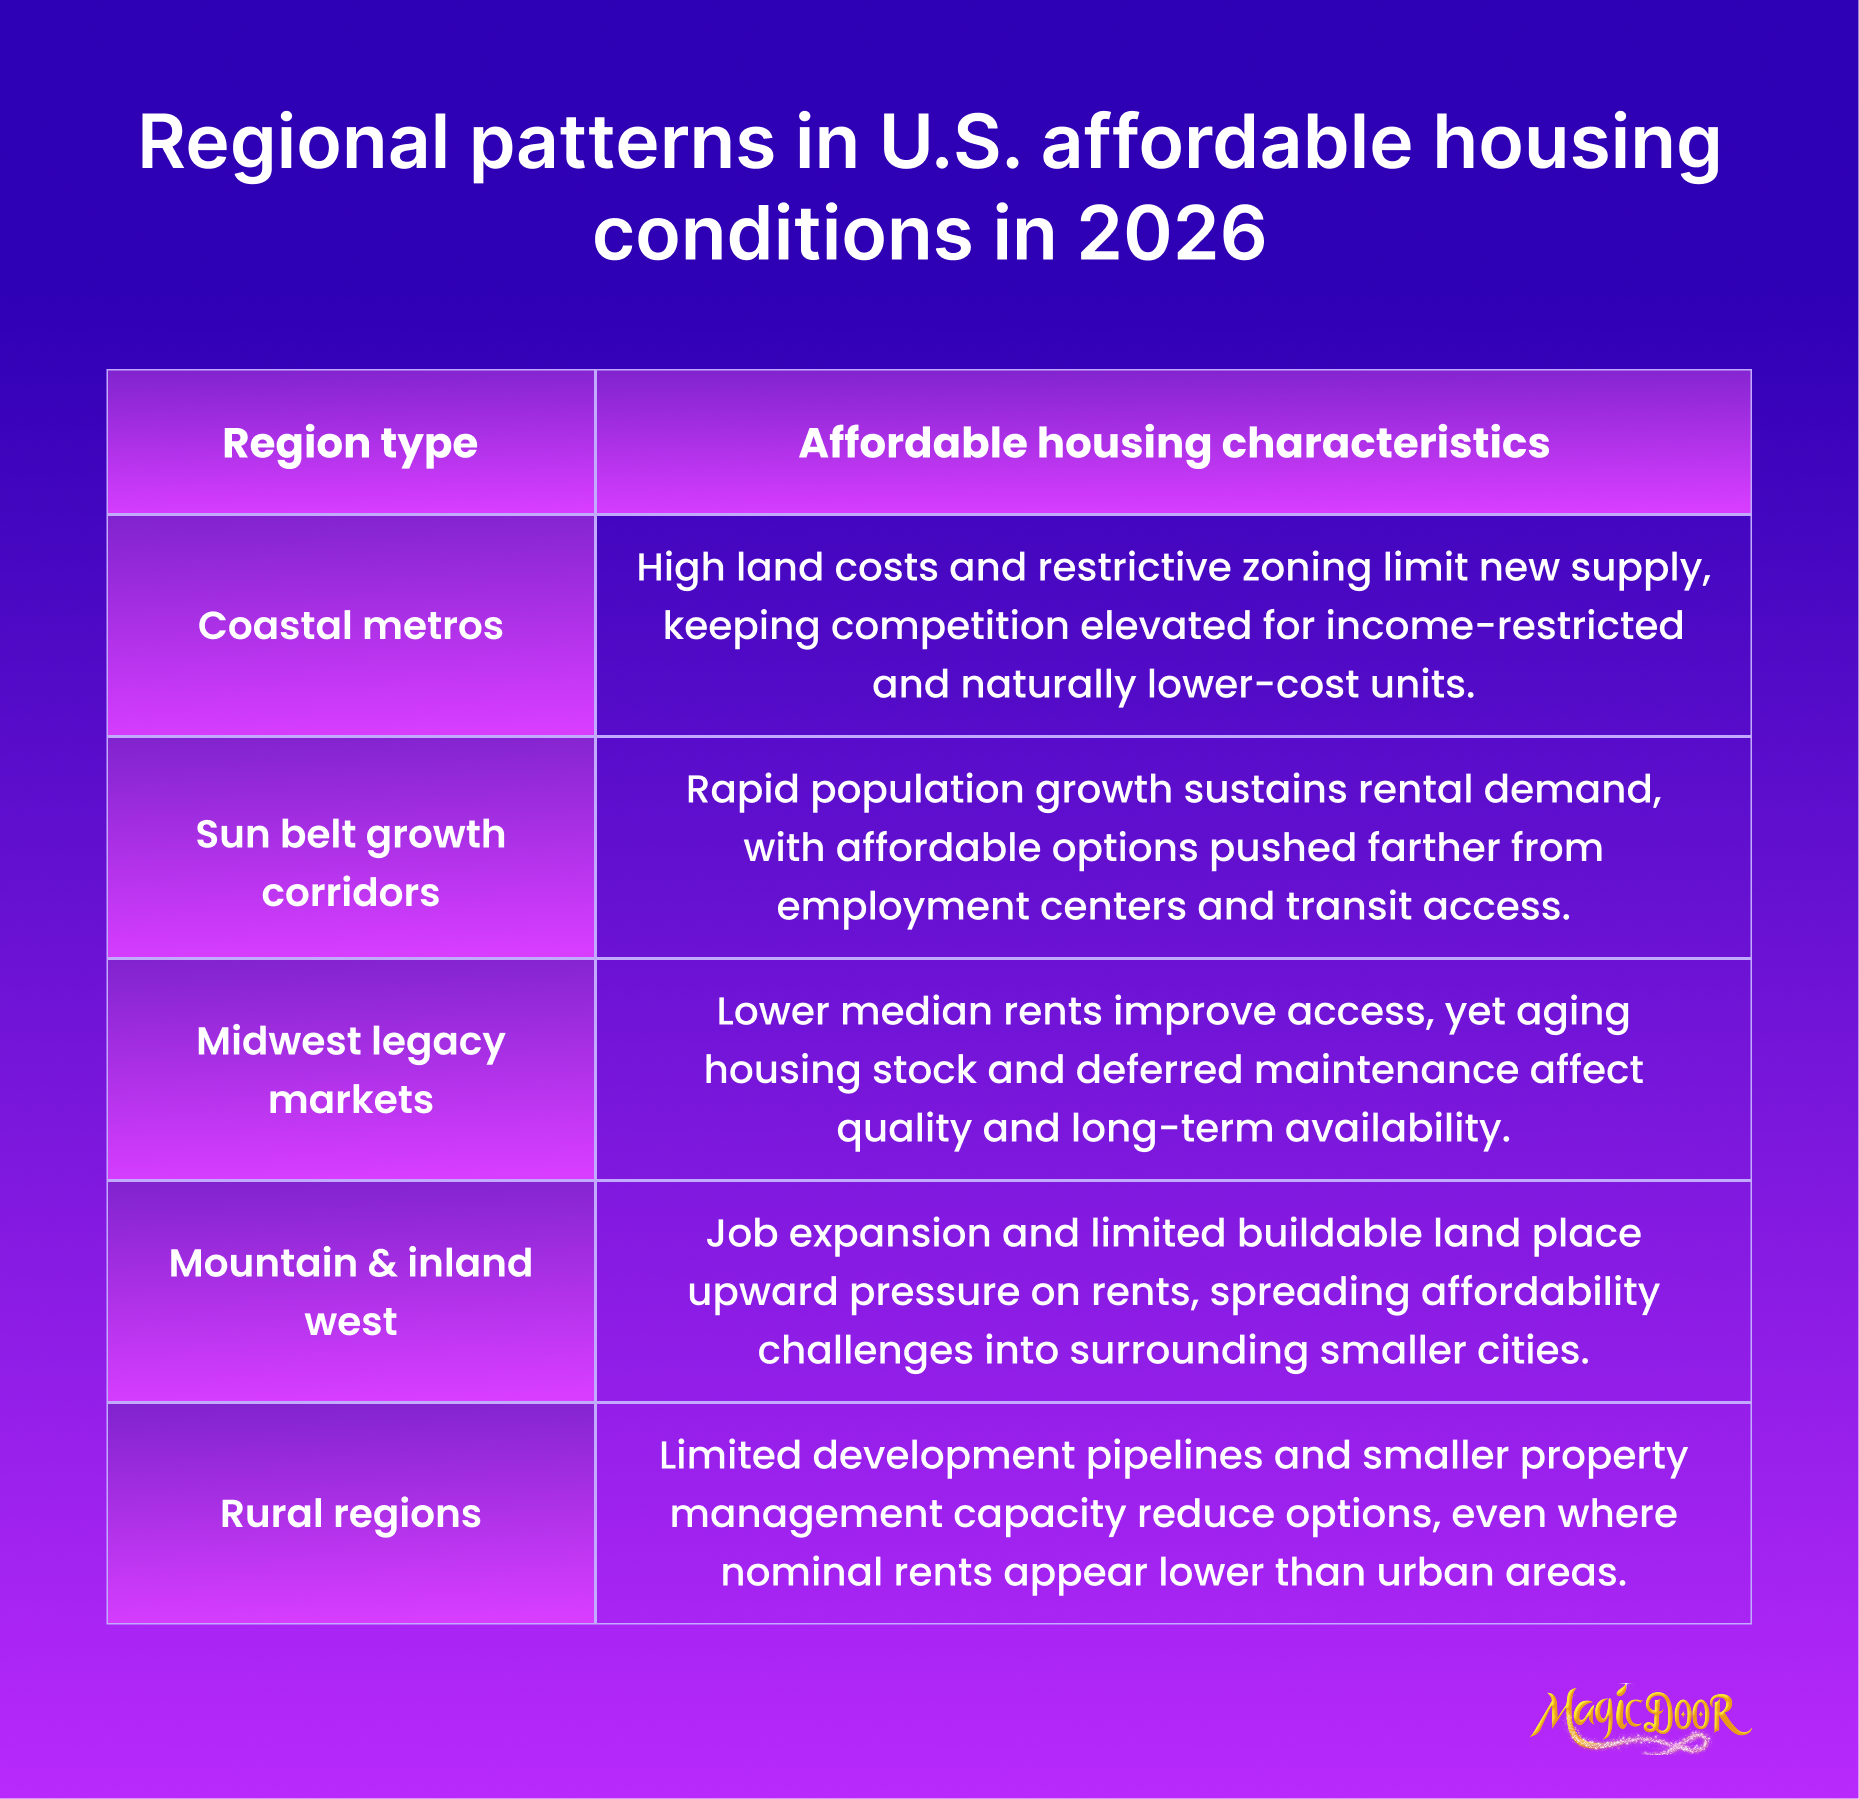
Affordable housing conditions vary widely across regions of the United States. Differences in construction levels, housing prices, population growth, and local economic conditions all influence how affordable housing markets develop in different states and cities.
Below are key statistics that illustrate regional differences in housing affordability and housing supply across the country.
- West Virginia recorded the lowest share of cost-burdened households in the country, with about 21.0% of households spending more than 30% of their income on housing.
- In California, more than 54.1% of renter households were cost-burdened, highlighting the significant housing affordability challenges in high-cost states.
Regional differences in housing affordability are also influenced by housing price trends.
- House price indices increased in every U.S. state and the District of Columbia between 2019 and 2024, according to data from the Federal Housing Finance Agency.
Population growth and local housing development levels also affect regional housing supply. Rapidly growing metropolitan areas in states such as Texas, Florida, and Colorado have seen increasing housing demand as residents relocate for employment opportunities.
In several large cities, housing development policies attempt to address affordability pressures.
- In some major cities, around 20% of newly approved housing units are designated as affordable housing developments, although demand continues to exceed supply in many urban markets.
Housing researchers also emphasize the broader economic impact of affordable housing development.
- Each dollar invested in affordable housing development generates local economic activity by leveraging both public and private funding sources.
Regional housing trends are important for property management professionals evaluating rental markets across the country. Housing affordability varies by location, and property managers operating in multiple markets often see large differences in rental demand, housing prices, and tenant eligibility for housing programs.
As housing markets continue to develop, many property managers are also adopting new operational tools to manage housing portfolios more efficiently.
Discussions about technologies such as AI assistants vs. virtual assistants for property managers are becoming more common as companies look for ways to handle leasing, tenant communication, and reporting tasks more effectively while operating in complex housing markets.
Affordable Housing Development Pipeline Data
Supply is not keeping up with demand. The numbers confirm it.
The U.S. faces a shortage of 7.1 million affordable and available rental homes for extremely low-income renters, just 35 units exist for every 100 households that need one.
New construction isn't closing that shortfall.In 2024, 608,000 multifamily units were completed, the most in nearly 30 years, yet that was barely enough to absorb the 849,000 renter households who entered the market that same year.
The lower end of the rental stock is disappearing:
- Since 2012, the market has lost 2.1 million units with contract rents under $600 per month.
- Between 2013 and 2023, units renting for an inflation-adjusted $1,000 or less fell by more than 30%.
- Affordability periods for more than 325,000 LIHTC units are set to expire between 2024 and 2029, with an additional 7,000 units lost each year prematurely through early program opt-outs.
For property managers working within LIHTC-regulated portfolios, expiring restrictions have direct compliance implications; income qualification thresholds, rent limits, and tenant eligibility all change at the end of affordability periods, and many owners have little transition runway built into their planning.
Affordable Housing Forecast & Market Projections
The near-term outlook for affordable housing is one of sustained demand pressure with modest supply relief.
HUD's 2025 Report to Congress found that 8.46 million renter households were living with "worst case" housing needs in 2023, virtually unchanged from the all-time high reached during the pandemic.
New supply is helping, but not where it counts. A record 27% of renters now spend more than half of their income on rent, and nearly half of all U.S. renters remain cost-burdened.
Rent growth is returning. After a flat 2024 to 2025 rent environment, pricing power is projected to return in 2026 and strengthen into 2027. Northeast markets are forecast at 4% to 5%, and Midwest markets at 3% to 4.5%.
Construction costs add another layer of pressure. Tariffs are expected to add between $12,800 and $25,500 to the cost of building a new single-family home, with homebuilders projecting a $10,900 increase in new home prices as a result.
For property managers, the projections point to one consistent reality: affordable units will stay occupied, but operating costs will keep rising.
What These Affordable Housing Statistics Mean for Property Managers
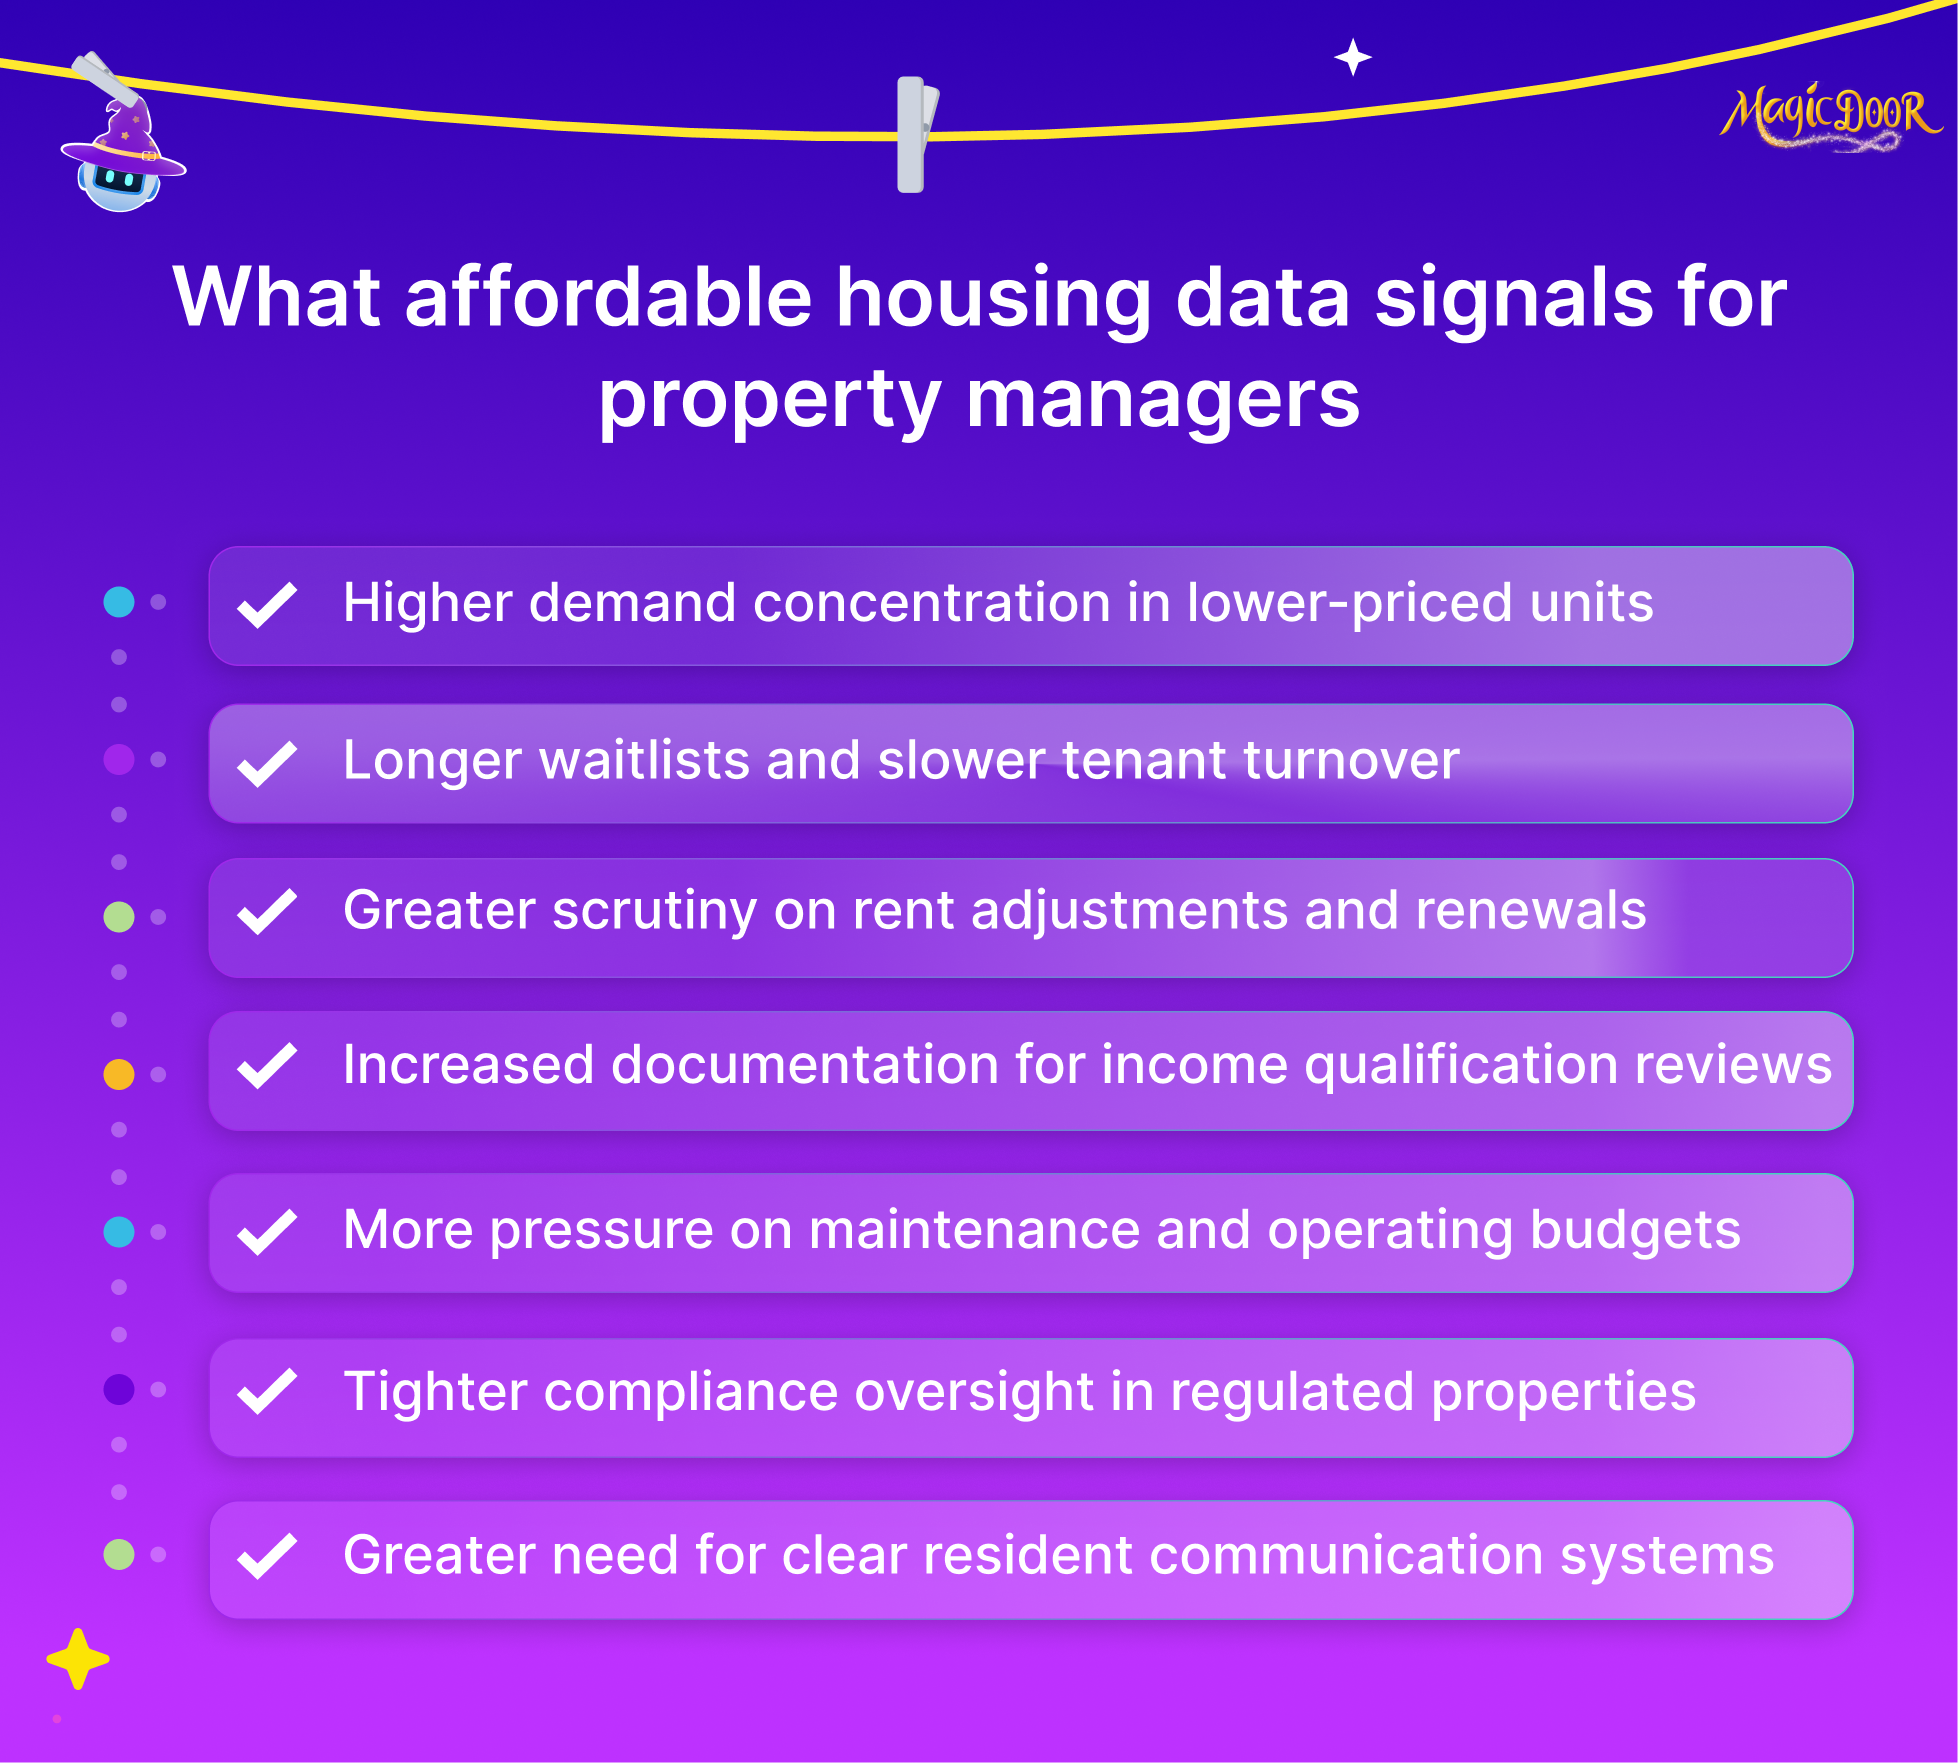
The numbers already tell the story. What matters here is what to do with them.
High cost-burden rates mean tenant financial stress is the norm in affordable portfolios, not the exception. Payment delays are more predictable than vacancies. Managing that reality requires consistent rent ledgers, clear late-payment protocols, and early communication systems, not reactive collection.
Declining homeownership and sustained renter demand mean affordable units stay occupied. That's a stability advantage. The risk sits on the cost side: insurance increases, maintenance inflation, and rent caps that don't move at the same pace.
Compliance is where most managers underestimate the workload. LIHTC restrictions expiring, income limits adjusting, and federal assistance programs in flux all create documentation exposure. A missed recertification or miscalculated rent limit isn't an administrative inconvenience. It's a regulatory violation with financial consequences.
Three practical takeaways:
- Track compliance deadlines at the unit level, not just the property level. Expiration dates vary across a portfolio.
- Document every income certification and rent adjustment with a clear audit trail. Verbal confirmations don't hold up to HUD reviews.
- Monitor operating costs separately from rent income. When premiums and maintenance rise faster than capped rents, the problem shows up quietly in monthly margins before it becomes a cash flow issue.
The statistics signal sustained demand. The operational challenge is managing a high-occupancy, compliance-heavy, margin-sensitive portfolio without the right systems in place.
Conclusion
Affordable housing statistics rarely point in a comfortable direction.
Demand is high. Supply is constrained. Costs are increasing faster than capped rents allow. And the regulatory atmosphere around federally subsidized portfolios is only getting more complex.
But that complexity is also predictable. The data covered in this guide doesn't describe chaos. It describes a market with consistent patterns: high occupancy, tenant financial pressure, compliance-driven risk, and sustained demand that won't reverse while homeownership remains out of reach for 75% of U.S. households.
Property managers who understand these patterns can plan around them. Those who don't tend to discover the problems during an audit or a cash flow shortfall.
The statistics are a starting point. What you build from them is the part that matters.